Low-salt products in Europe
The World Health Organization recommends a salt consumption of up to 5 g per day. To enable daily salt consumption to be calculated, all products should be labelled indicating the concentration, and then the consumer can estimate the amount of each ingredient that is eaten, assuming that they estimate accurately the weight of each food item they eat. Salt content needs to be indicated in terms of sodium, because sodium is a component of other ingredients, including sodium bicarbonate, sodium erythorbate, sodium isoascorbate and sodium nitrite/nitrate, all of which are used in meat manufacture. Currently there is some confusion, as some products give the salt content, while others give sodium, and a few products present both.
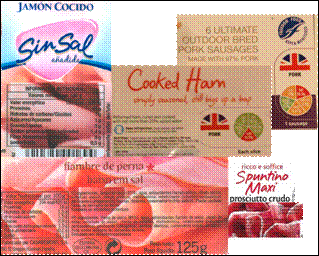
Figure 2. 1 Examples of labels indicating salt concentration

The amount of salt in pig-meat products and the approaches used to reduce salt content differ between countries across Europe (Table 2). For example, in the UK in 2004 the Food Standards Agency (FSA) launched a strategic plan which included:
1 an advertising campaign encouraging consumers to check food labels for salt content
2 a simple system for highlighting the salt (also fat and sugar) content
3 a target reduction in average salt intake from 9.5 g to 6 g per day by 2010.
(FSA, 2007)
Similarly, in 2010 Hungary introduced a salt reduction programme including:
1 an awareness-raising campaign providing reliable information using informative leaflets, advertisements, radio programmes and a specialised website
2 the launch of a programme to reduced salt content, involving the food industry, public caterers and ministries.
(National Institute for Food and Nutrition Science (OETI), 2010)
Table 2.2 Examples of low and normal salt content in some European pig-meat products, taken from original labels
| Product | Country of origin |
Salt content / 100g Low salt formulation |
Salt content / 100g Normal salt formulation |
| Ham | |||
| Cooked ham (without sodium chloride) | Spain | 0.5g sodium | 0.97 sodium* |
| Cooked ham (low salt) | Spain | 0.11g sodium | |
| Cooked ham | Italy | 0.9 | 2.5 |
| Raw ham | Italy | 2.5 | 6.5 |
| Cooked ham | England | 1.05 (0.42g sodium) | 2.5 (1g sodium) |
| England | 1.38 | ||
| Coarsely ground cooked ham | Finland | - | 1.8 (range between 1.7 - 2.1) |
| Cooked cured ham | Hungary | - | Mean 2.96† |
| Preserved products | |||
| Salami | Italy | - | 4 |
| Pancetta (pork belly) | Italy | - | 5 |
| Fermented salami | Hungary | - | Mean 3.26† |
| Fermented sausages | Finland | - | 4 (range between 3.6 - 4.7) |
| Bacon | |||
| Bacon | England | 3.1 | 3.38 |
| Sausages | |||
| Breakfast sausages | England | 1 (0.4g sodium) | 1.30 (0.52 sodium) |
| England | 0.45 sodium | 1.43 (0.57 sodium) | |
| Sausages (cooked and raw) | Finland | 1.3 | From 1.35 to 1.74 |
| Cooked sausages | Hungary | - | Mean 1.84† |
| Frankfurters | |||
| Frankfurters (vacuum packed) | England | - | 1.8 (0.7 sodium) |
| Frankfurters (canned) | England | - | 0.3 sodium |
| Frankfurters (in jar) | England | - | 1.0 sodium |
*data from Spanish Food Composition Database (http://www.bedca.net)
†data from the OETI Survey of Salt Content
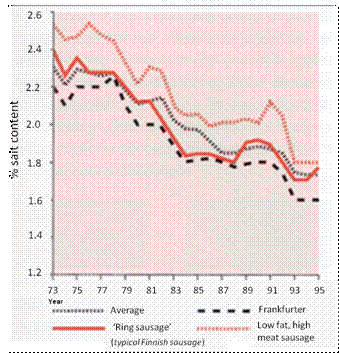
As mentioned in the Section 1, Finland is one of the few countries where a strategy was adopted as a community-based collaboration with the food industry to develop reduced-salt food products. Figure 2 illustrates the impact this had on percentage salt content in sausages from 1973 to 1995, where it has stayed since then.
Figure 2.2 Percentage salt content in sausages in Finland, 1973-1995 (From: Vartiainen, 1998)

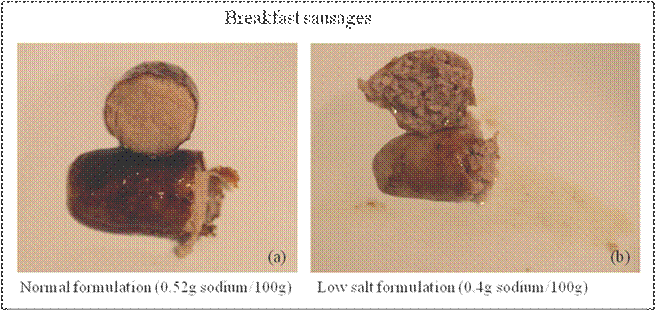
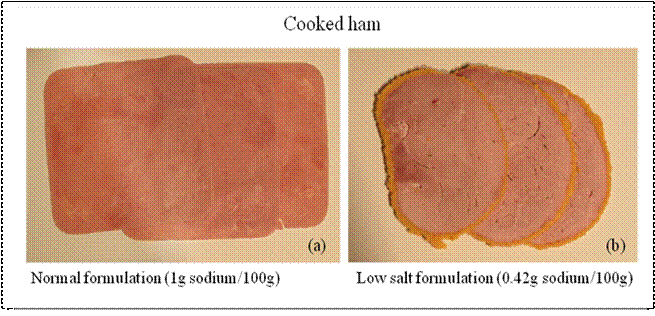
As you will see in Section 3 Science of Salt in Pig Meats and Section 4 Low-salt Pig Meat Formulations, reducing this target is not a straightforward procedure and it can have some detrimental effects on processing and final product quality. Figures 3 and 4 illustrate some of the physical characteristics that can be affected when salt is reduced.
Figure 2.3 Breakfast sausages with (a) normal formulation and (b) low-salt formulation

Figure 3 Cooked ham with (a) normal formulation and (b) low-salt formulation

Activity 2.1
Look at the examples of pork products in Figures 2.3 and 2.4. What physical differences can you see between the products containing low salt and the normal formulations? Note down your observations.
Keeping in mind the difficulties associated with reducing the salt content of pig-meat products, but also the WHO maximum salt intake recommendation, the FSA has produced some targets for the coming years for the main pork products in the UK. These targets were agreed in 2007 and are shown in Table 3.
Table 2.3 Target salt concentrations for UK pig-meat products proposed by FSA for 2010 and 2012
| Product | Targets for 2010 (g Na/100g) | Targets for 2012 (g Na/100g) |
| Bacon | 3.13 | 2.88 |
| Ham | 2.0 | 1.63 |
| Breakfast sausage | - | 1.13 |
| Pastries with pork-base filling | 1.13-1.38 | 1.0-1.13 |
| Frankfurters (canned) | - | 1.38 |
| Frankfurters (fresh) | - | 1.63 |
Activity 2.2
Look at Tables 2 and 3. How do UK commercial ham and bacon compare to the targets set for 2010?
Could you say that the targets have been achieved?