Human salmonellosis in Europe
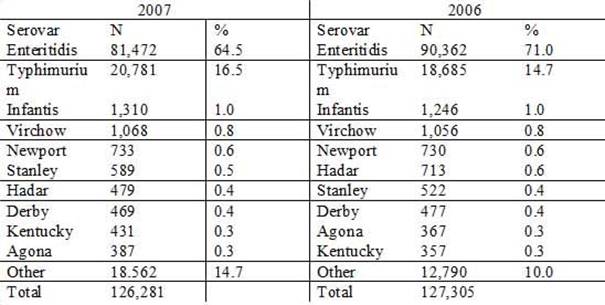
Human salmonellosis is one of the most important foodborne zoonoses, competing with campylobacteriosis for the first position on the table of the most common foodborne zoonoses in Europe (EFSA and ECDC, 2009a). The most common serotypes of Salmonella isolated from human outbreaks are S. Enteritidis and S. Typhimurium accounting for 80% to 85% of the outbreaks (Table 2, data from 2006-2007) (EFSA and ECDC, 2009b).
Table 2. Distribution of confirmed salmonellosis cases in humans by serovar (10 most frequent serovars), 2006-2007. Adapted from EFSA and ECDC (2009a)

Source Countries: Austria, Belgium, Cyprus, Czech Republic, Denmark, Estonia, Finland, France, Germany, Hungary, Ireland, Italy, Latvia, Luxembourg, Malta, The Netherlands, Portugal, Slovakia, Slovenia, Spain, Sweden and the United Kingdom.
The cases of salmonellosis may be split into two major categories, the ones that are domestically acquired and the ones that are acquired abroad (through travelling). There are also many cases where it is difficult to make such a distinction as it is clear in Table 3. Regarding the domestically acquired outbreaks, 9% to 15.7% can be attributed to domestically produced pork (EFSA, 2008b).
Table3. Distribution of confirmed salmonellosis cases in humans by reporting countries and origin of case (domestic/imported), 2007. Adapted from EFSA and ECDC (2009a)
| Country | Domestic (%) | Imported (%) | Unknown (%) | Total (n) |
| Austria | 86.2 | 13.8 | 0 | 3,375 |
| Belgium | 0 | 0 | 100.0 | 3,973 |
| Bulgaria | 0 | 0 | 100.0 | 1,136 |
| Cyprus | 81.0 | 3.8 | 15.2 | 158 |
| Czech Republic | 98.6 | 1.4 | 0 | 17,655 |
| Denmark | 3.1 | 10.2 | 86.7 | 1,662 |
| Estonia | 94.2 | 5.8 | 0 | 430 |
| Finland | 13.6 | 83.0 | 3.4 | 2,737 |
| France | 0 | 0 | 100.0 | 5,510 |
| Germany | 90.5 | 4.4 | 5.1 | 55,400 |
| Hungary | 99.8 | 0.2 | 0 | 6,575 |
| Ireland | 33.9 | 31.6 | 34.5 | 440 |
| Italy | 0 | 0 | 100.0 | 4,499 |
| Latvia | 98.1 | 1.9 | 0 | 619 |
| Lithuania | 99.0 | 1.0 | 0 | 2,270 |
| Luxembourg | 93.9 | 6.1 | 0 | 163 |
| Malta | 96.5 | 3.5 | 0 | 85 |
| Netherlands | 87.1 | 12.9 | 0 | 1,245 |
| Poland | 0 | 0 | 100.0 | 11,155 |
| Portugal | 0 | 1.0 | 99.0 | 482 |
| Romania | 0 | 0 | 100.0 | 620 |
| Slovakia | 99.4 | 0.6 | 0 | 8,367 |
| Slovenia | 0 | 0 | 100.0 | 1,346 |
| Spain | 100.0 | 0 | 0 | 3,658 |
| Sweden | 23.9 | 73.7 | 2.4 | 3,930 |
| United Kingdom | 24.0 | 21.4 | 54.6 |
13,802 |
| EU Total | 65.1 | 7.9 | 27.0 | 151,292 |