Statistics
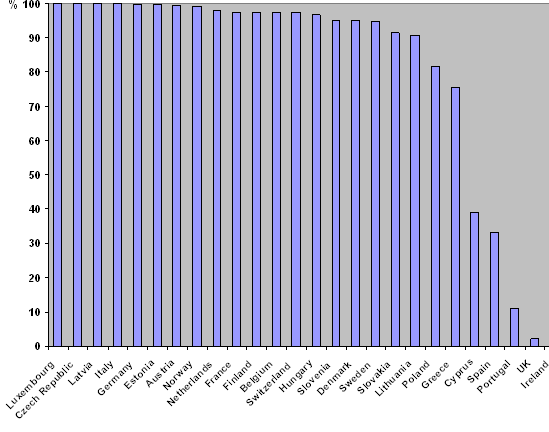
About 100 million pigs are castrated each year in the 25 EU countries, representing 83% of the EU male pig population (EFSA, 2004). Male pigs in conventional production are castrated in almost all European countries (see Figure 2). Some of the European countries have alternative production systems based on entire male pigs.
In the US 90% of male piglets are surgically castrated without anaesthesia before weaning.

Figure 2: Estimates of the percentage of male pigs (conventional production) castrated per country, given as the average of answers from each country (From Fredriksen et al., 2009).
Male piglets are normally castrated within 7 days of birth (see Table 1). The practice is also regulated by an EU Directive that stipulates that if castration is performed after 7 days it should be performed under painkillers and by a veterinarian.
Table 1 shows the number of male pigs left entire and the number of male pigs castrated with and without anaesthesia, estimated from the information given in PIGCAS WP2 - Extent of practice.
Castration of male pigs has been generally abandoned in a number of countries including Australia, Ireland and the UK, and has been partially abandoned in Portugal and Spain.
Table 1: Statistics on number of pigs slaughtered in EU and other selected countries in 2006.
| Country | Million pigs | Percentage of males castrated | Male pigs castrated | Males left entires | Male pigs castrated with anaesthesia | Male pigs castrated without anaesthesia |
| Austria | 5.4 | 99.6 | 2.69 | 0.01 | 0.05 | 2.63 |
| Belgium | 10.7 | 97.5 | 5.21 | 0.14 | 0.03 | 5.19 |
| Cyprus | 0.6 | 39.0 | 0.12 | 0.18 | 0.00 | 0.12 |
| Czech Republic | 4 | 100.0 | 2.00 | 0.00 | 0.00 | 2.00 |
| Denmark | 21.4 | 95.0 | 10.17 | 0.54 | 0.0 | 10.17 |
| Estonia | 0.4 | 99.7 | 0.20 | 0.00 | 0.00 | 0.20 |
| Finland | 2.4 | 97.5 | 1.17 | 0.03 | 0.02 | 1.15 |
| France | 25.5 | 97.5 | 12.43 | 0.32 | 0.00 | 12.43 |
| Germany | 50.1 | 99.8 | 25.00 | 0.05 | 0.45 | 24.55 |
| Greece | 2 | 75.6 | 0.76 | 0.24 | 0.00 | 0.76 |
| Hungary | 5.2 | 96.7 | 2.52 | 0.08 | 0.40 | 2.11 |
| Ireland | 2.7 | 0.0 | 0.00 | 1.35 | 0.00 | 0.00 |
| Italy | 13.4 | 100.0 | 6.70 | 0.00 | 0.00 | 6.70 |
| Latvia | 0.5 | 100.0 | 0.25 | 0.00 | 0.00 | 0.25 |
| Lithuania | 1.3 | 90.8 | 0.59 | 0.06 | 0.17 | 0.42 |
| Luxembourg | 0.1 | 100.0 | 0.05 | 0.00 | 0.00 | 0.05 |
| Netherlands | 14 | 97.8 | 6.84 | 0.16 | 0.09 | 6.76 |
| Norway | 1.4 | 99.0 | 0.69 | 0.01 | 0.69 | 0.00 |
| Poland | 24.3 | 81.8 | 9.94 | 2.21 | 1.21 | 8.73 |
| Portugal | 5.4 | 11.2 | 0.30 | 2.40 | 0.00 | 0.30 |
| Slovakia | 1.3 | 91.4 | 0.59 | 0.06 | 0.11 | 0.48 |
| Slovenia | 0.4 | 95.0 | 0.19 | 0.01 | 0.00 | 0.19 |
| Spain | 39.3 | 33.2 | 6.52 | 13.13 | 0.06 | 6.46 |
| Sweden | 3 | 94.8 | 1.42 | 0.08 | 0.02 | 1.40 |
| Switzerland | 2.9 | 97.3 | 1.41 | 0.04 | 0.03 | 1.38 |
| UK | 9.1 | 2.1 | 0.09 | 4.46 | 0.00 | 0.09 |
| Total | 246.8 | 79.3 | 97.85 | 25.55 | 3.33 | 94.52 |
(Faostat, Rome, Italy, faostat.fao.org/default.aspx). From Fredriksen et al., 2009.